

Using the electrocardiogram, we evaluate the electrical and muscular functions of the heart to evaluate pathologies such as myocardial ischemia, syncope, palpitations and even heart attack.
We could also perform the ECG using textrodes by means of an electronic device incorporated in a garment, especially indicated for neonates, which can be used in incubators and consists of textile electrodes in different leads with the aim that in any position in which the child has contact with the textrodes necessary to acquire the ECG signal.
This device in a completely autonomous way or with the help of a professional can determine:
- The orientation of the heart (as it is located) in the thoracic cavity.
- Evidence of increased thickness (hypertrophy).
- Evidence of damage to various parts of the heart muscle.
- Evidence of acutely disturbed blood flow.
- Abnormal electrical activity patterns that may predispose the patient to abnormal heart rhythm disorders.
Prediction
Sudden heart attack and increased deaths: growing concern.
In the last decade, deaths from sudden heart attacks increased enormously, particularly in developing countries, apart from genetic and lifestyle styles, the lack of medical resources in rural areas causes most of the deaths in heart attacks.
The reasons for death from heart attack in different countries are due to: rural areas without sanitary facilities, lack of awareness about the symptoms of cardiac arrest leads to death and increased cases of heart disease.
ECG analyzer machines on the market and its features:
- Today's IoT medical device sends massive ECG data to mobile or server and analysis is performed on mobile application or high-performance servers.
- Computer-based application that receives signals from the ECG device and analyzes the ECG patterns.
- The entire ECG analysis device relies on the Internet or high-processing computers or mobile applications.
We can summarize it in the following points:
- Reliance on the Internet for mass transmission of ECG data.
- Requires system or mobile application.
- A high computational system is needed.
E.C.G.
The solution is to convert human observations into data sets.
This is how to increase the accuracy of the ECG analyzer model.
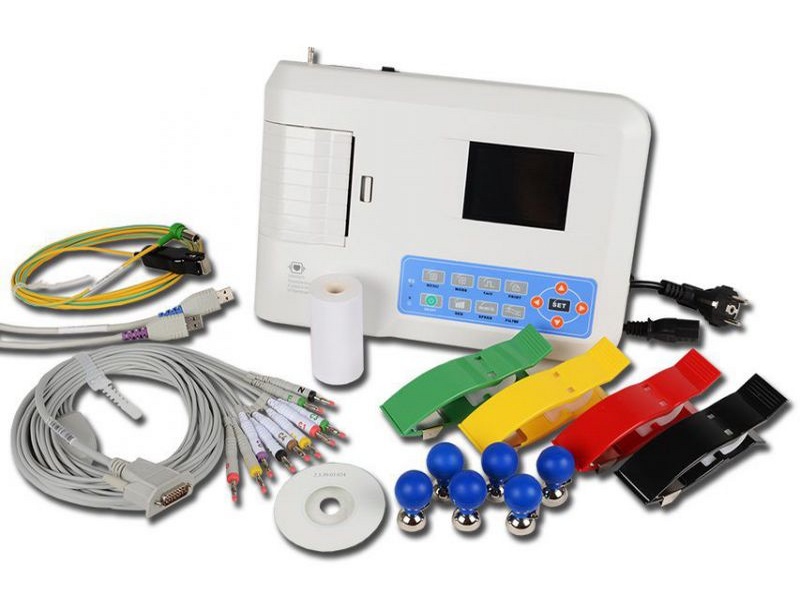
As a result we have developed a pocket-sized mini-diagnostic ECG analyzer device that can independently diagnose heart disease without the Internet.
Electrocardiogram
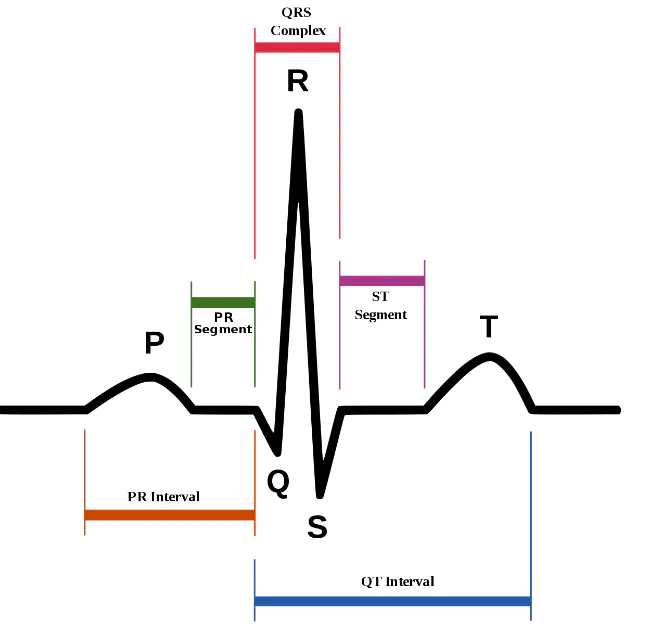
ECG Graph Basics
The ECG graph is divided into 5 waves: P, Q, R, S and T waves.
Atrial fibrillation
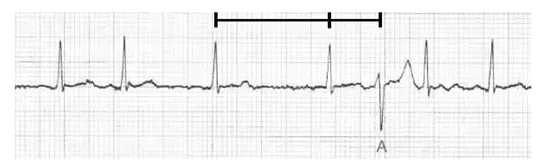
Irregular heart rate: The difference between the current R-R interval and the previous R-R interval is 200 ms
First degree heart block
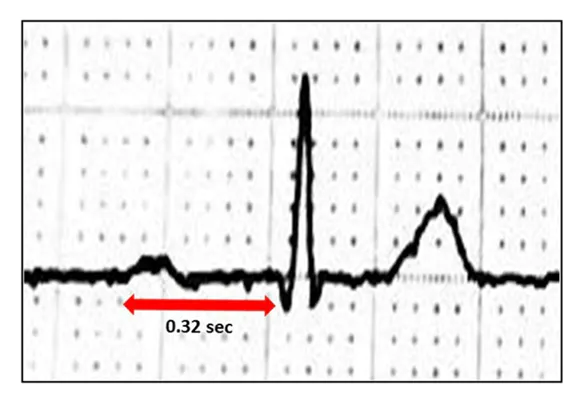
If the P-R interval exceeds 200 ms, it may be indicated as first-degree heart block
ECG electrode placement
ECG electrodes are placed in RA, LA and LL as mentioned in the following diagram and connect to our ECG analyzer.
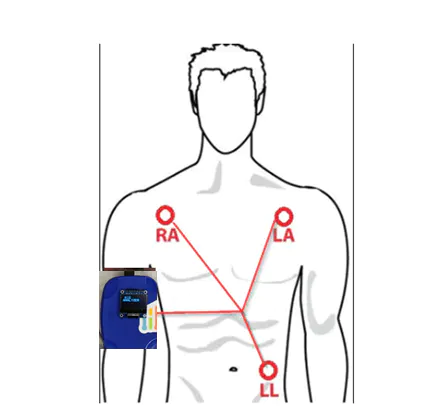
For best results: place the electrodes on the chest wall equidistant from the heart (instead of the specific extremities)
Novel approach to produce quality data sets
In machine learning, the accuracy and performance of a model are determined
by the quality and divergence of a data set.
If you look at the ECG data, it is really difficult to distinguish the different heart conditions with the normal ECG data in a shorter window time (example: 3 seconds)

Normal ECG data
When training a model with filtered ECG data only for atrial fibrillation, normal heart block, and first degree, the accuracy is less than 23%. The reason is that in the shorter window the model cannot differentiate the difference. If a longer window time is sought, the processing time and maximum RAM usage increase quite a bit, but without precision.
Background of the novel approach:
When a doctor or a trained person analyzes the ECG graph, they will be counting the small squares between the R wave to R, the interval P to R and they will write the counts on the graph or save it for calculation.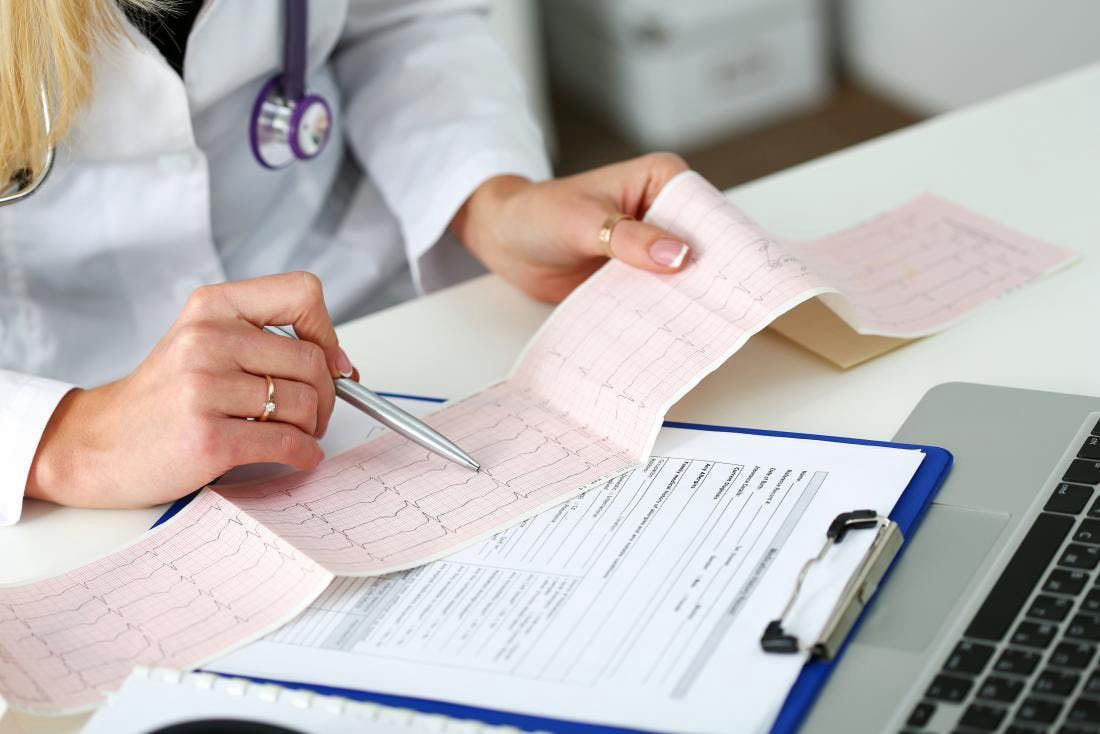
ECG chart reading
The solution is to convert human observations into data sets.
This is how to increase the accuracy of the ECG analyzer model.
As a result we have developed a pocket-sized mini-diagnostic ECG analyzer device that can independently diagnose heart disease without the Internet.